
Hair Care
Expected Returns & The 7 Year Itch
Jul
Investors have an unusual relationship with expected returns. When markets are rising, forecasts seem unnecessarily gloomy. When markets are falling, the same forecasts suddenly feel recklessly optimistic. In both cases, the spreadsheet is usually less emotional than the person staring at it.
The “seven-year itch” in investing describes the temptation to abandon a portfolio, asset class, or long-term plan after several disappointing years. It also refers to the seven-year forecasting horizon used by some institutional investment firms. Seven years is long enough for valuation, earnings, interest rates, and investor sentiment to matterbut not long enough to make uncertainty disappear.
That distinction is important. An expected return is not a promise, a target, or a market prophecy carved into a marble bull. It is a reasonable estimate built from today’s prices and assumptions about tomorrow’s income, growth, inflation, and valuation. Understanding that estimate can improve financial planning. Worshiping it can produce an impressive collection of avoidable mistakes.
What Is an Expected Return?
An expected return is the average annual gain an investment might generate over a specified period under a set of assumptions. It should be viewed as the center of a wide range of possible outcomes, not as the market’s appointment time.
Suppose an analyst estimates that a diversified stock portfolio has an expected nominal return of 6% a year for the next seven years. That does not mean the portfolio will politely earn 6% every calendar year. It might gain 22%, fall 17%, rise 9%, move sideways, and eventually arrive somewhere nearor nowhere nearthe estimate.
Professional capital-market assumptions typically combine historical evidence, current yields, market valuations, economic scenarios, volatility, correlations, and judgments about future conditions. BlackRock explicitly treats its forecasts as uncertain estimates rather than single guaranteed outcomes, while J.P. Morgan publishes long-term assumptions conditioned on economic and market scenarios.
Nominal Returns Versus Real Returns
A nominal return is the percentage gain before inflation. A real return measures the increase in purchasing power after inflation. The difference can look small on paper and enormous in retirement.
For example, a 6% nominal return with 2.5% annual inflation produces a real return of approximately 3.4%, not 3.5%, because the precise calculation is:
Real return = (1 + nominal return) ÷ (1 + inflation) − 1
On a $100,000 portfolio, 6% annual growth would produce roughly $150,363 after seven years. After adjusting for 2.5% annual inflation, however, the ending value would have purchasing power closer to $126,000 in today’s dollars. Inflation does not steal the account balance. It quietly changes what the balance can buy.
Why Do Forecasters Use Seven Years?
Seven is not a magical market number. Stocks do not receive a notification after 84 months announcing that it is time to mean-revert. The horizon is useful because valuation has historically been more informative over longer periods than over the next quarter or year.
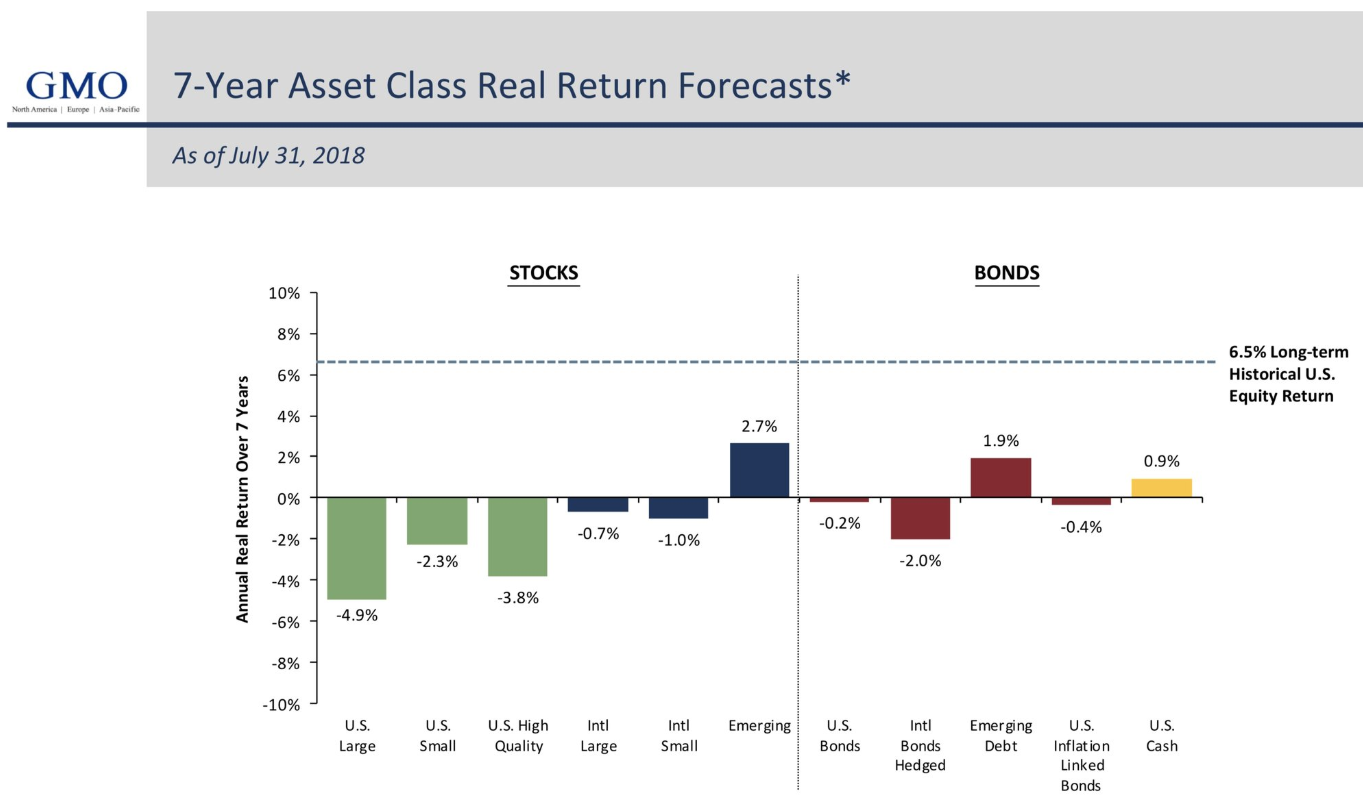
The original discussion behind “Expected Returns & The 7 Year Itch” examined seven-year real-return forecasts from GMO. Those forecasts sometimes looked extremely pessimistic, particularly when asset prices were elevated. The central lesson was not that seven-year projections are useless. It was that even sophisticated estimates can be early, wrong, overwhelmed by changing conditions, or correct for reasons that take years to become visible.
At short horizons, markets are heavily influenced by earnings surprises, liquidity, policy changes, geopolitical events, and investor mood. Over longer horizons, starting valuation, income, and fundamental growth tend to play larger roles. AQR’s research similarly argues that current valuation matters most for medium-term forecasts, while history and economic theory become more important as the horizon extends beyond 20 years.
In other words, seven years is a compromise. It is long enough to discuss expected returns seriously and short enough to remind us that serious people can still be seriously surprised.
The Building Blocks of Expected Stock Returns
Long-term equity returns can be understood through several basic components:
Dividend yield + earnings growth + changes in valuation − dilution and other drags
Dividends provide cash income. Earnings growth can increase the value of the underlying businesses. Changes in valuation determine whether investors are willing to pay more or less for each dollar of earnings. Share repurchases may help per-share results, while stock issuance can dilute existing owners.
J.P. Morgan’s 2026 long-term assumptions, for example, estimated a 6.7% return for U.S. large-cap stocks. Its decomposition included contributions from revenue growth, dividends, and buybacks, offset by expected pressure from valuation changes, margins, and dilution.
Valuation Matters, but It Is Not a Stopwatch
A high price-to-earnings ratio generally suggests that investors are paying generously for future profits. All else being equal, paying a higher price reduces the return available from the same stream of future cash flows.
However, “expensive” does not automatically mean “about to crash.” Valuation can remain elevated while earnings grow, interest rates change, or investors continue accepting a lower risk premium. BlackRock cautions that price-to-earnings ratios alone can miss important information, including future interest rates and the equity risk premium.
Valuation is therefore better treated as a dimmer switch for long-term expectations than as an on-off switch for market exposure.
The Difference Between Historical and Expected Returns
U.S. stocks have produced impressive long-term results. Fidelity calculates that the S&P 500 generated an average annual return of approximately 10.4% during the 30 years ending in December 2025. The ten-year annualized return over the period ending in 2025 was substantially higher at approximately 14.8%.
Those numbers describe what happened. They do not tell us what must happen next.
Historical averages can be misleading when starting yields, valuations, interest rates, taxes, fees, or economic structures differ from the past. AQR notes that the long-run real return on U.S. equities has been close to 7%, but also argues that current prospects may be lower because starting market yields are comparatively modest.
NYU professor Aswath Damodaran’s long-running database of U.S. stock, Treasury bond, and Treasury bill returns demonstrates another important point: averages contain enormous variation. A long-term result is assembled from booms, recessions, inflation shocks, panics, technological breakthroughs, wars, and years when the market apparently drank herbal tea and did very little.
What Major Firms Currently Expect
Current forecasts differ because institutions use different models, scenarios, time horizons, and definitions. These estimates should not be averaged into a supposedly perfect number. Their disagreement is itself a useful measure of uncertainty.
| Institution | Asset or Portfolio | Long-Term Annualized Estimate |
|---|---|---|
| Vanguard | U.S. stocks | Approximately 4%–5% |
| Vanguard | High-quality U.S. bonds | Approximately 4% |
| Charles Schwab | U.S. large-cap stocks | Approximately 5.9% |
| Charles Schwab | Developed international stocks | Approximately 7% |
| J.P. Morgan | U.S. large-cap stocks | Approximately 6.7% |
| J.P. Morgan | Global 60/40 portfolio | Approximately 6.4% |
Vanguard’s more restrained U.S. stock outlook reflects elevated valuations, particularly among large technology companies. Schwab expects international developed stocks to outperform U.S. large caps over the coming decade because overseas valuations are more attractive. J.P. Morgan’s assumptions are somewhat higher but still imply returns below the unusually strong U.S. equity performance of the preceding decade.
None of these forecasts guarantees weak U.S. stock performance. They indicate that investors may need to prepare for a less generous environment in which income, diversification, savings, cost control, and patience contribute more visibly to success.
The Psychological Seven-Year Itch
The most dangerous seven-year forecast may be the one investors create in their own heads.
After several strong years, people naturally raise their expectations. A 12% annual return starts to feel normal. A 6% gain feels disappointing, even though it may be perfectly respectable. After a long period of weak performance, investors make the opposite mistake: they assume the disappointment will continue forever.
AQR distinguishes between objective expected returns derived from market prices and subjective expectations held by investors. Its research finds that investor optimism has often been highest after strong markets, when valuations imply lower prospective returns. Pessimism has frequently intensified after declines, when cheaper prices improve long-term potential.
This pattern creates a familiar cycle:
- An asset class performs well.
- Investors notice and buy it.
- Its valuation rises and future expected returns decline.
- Performance eventually cools.
- Investors become impatient and sell.
- The neglected asset becomes cheaper and more promising.
- Someone writes an article asking why nobody saw it coming.
Morningstar’s investor-return research repeatedly finds that the average dollar invested in funds can earn less than the funds themselves because purchases and sales occur at unfavorable times. Frequent trading and volatile investment categories have tended to produce larger behavior gaps.
How Investors Should Use Expected Returns
1. Plan With a Range, Not a Single Number
A retirement plan based entirely on an 8% annual return can become fragile. A more useful approach is to test several scenarios, such as 4%, 6%, and 8% nominal returns.
For a $100,000 portfolio invested for seven years:
- At 4%, it grows to approximately $131,593.
- At 6%, it grows to approximately $150,363.
- At 8%, it grows to approximately $171,382.
The difference between the low and high scenarios is almost $40,000. That is why a financial plan should not collapse simply because reality chooses a different row in the spreadsheet.
2. Match the Portfolio to the Goal
Money needed within a few years should not depend entirely on stocks reaching a favorable valuation on a particular date. Long-term assets can tolerate more market risk because they have additional time to recover. Near-term spending reserves generally need greater stability.
Expected return should therefore be considered alongside volatility, liquidity, time horizon, taxes, and the consequences of loss. The highest-returning theoretical portfolio is not automatically the best portfolio for a real person with tuition bills, a mortgage, or an unfortunate talent for panicking on Tuesdays.
3. Diversify Across Sources of Return
Diversification does not guarantee a profit, but it reduces dependence on one company, sector, country, or market outcome. U.S. stocks, international equities, high-quality bonds, inflation-protected securities, and cash reserves each respond differently to economic conditions.
Fidelity describes diversification as limiting exposure to any single type of asset, while the S&P 500 itself represents about 80% of available U.S. market capitalization rather than the entire global investment universe.
4. Rebalance Instead of Predicting
Rebalancing sells a portion of assets that have grown beyond their intended weight and buys assets that have fallen below their allocation. It is not glamorous. It rarely generates exciting dinner conversation. That is part of its charm.
A disciplined rebalancing policy turns valuation changes into portfolio maintenance rather than an emergency forecast. It also helps investors buy relatively cheaper assets without requiring them to announce precisely when the market will turn.
5. Control What Can Be Controlled
Investors cannot control market returns. They can influence savings, fees, taxes, diversification, withdrawal rates, and behavior. When expected returns decline, the most reliable response may be to save slightly more, work slightly longer, reduce unnecessary costs, or adjust future spendingnot to hunt for an exotic product promising 14% with “virtually no risk.” That sentence has purchased many salespeople very nice watches.
Why Market Timing Rarely Solves the Problem
A low expected return is not the same as an expected immediate loss. Selling simply because long-term forecasts are subdued creates a second forecasting problem: deciding when to reinvest.
Large market gains are often concentrated in a small number of trading days. Schwab calculates that the S&P 500 returned about 11% annually from 2006 through 2025, but the annualized result fell to 6.6% when the ten best days were excluded. Fidelity has reported similarly severe consequences from missing only a handful of strong sessions.
FINRA also warns that return chasing and short-term market timing can cause investors to buy near highs and sell during declines. Patient, periodic investing does not eliminate volatility, but it reduces the need to make two perfectly timed decisions.
This does not mean investors should ignore valuation. It means valuation should influence planning assumptions, portfolio construction, and rebalancingnot trigger an all-or-nothing bet.
Experiences From the Seven-Year Itch
The following experiences are composite examples based on common investor behavior rather than personal investment recommendations.
The Investor Who Confused a Great Company With a Great Price
One investor began buying a group of dominant technology companies after years of exceptional earnings growth. The businesses were profitable, innovative, and widely admired. Every podcast guest seemed to own them. Every family gathering included a cousin explaining why traditional valuation was obsolete.
For two years, the strategy worked beautifully. The investor concluded that concentrated portfolios were not especially dangerous if the companies were sufficiently wonderful. More money went into the same names, and the expected return was mentally estimated by looking at the previous three years.
Then the companies continued growing while their stocks stopped outperforming. Nothing dramatic happened to the businesses. The purchase prices had simply incorporated years of good news. The lesson was uncomfortable but valuable: a successful company can be a disappointing investment when expectations embedded in its valuation are too ambitious.
The investor eventually diversified, not because the companies had become bad, but because the portfolio had become dependent on perfection.
The Investor Who Abandoned International Stocks
Another investor held U.S. and international index funds. After years of U.S. outperformance, the overseas allocation looked like luggage from a trip nobody remembered taking. Each annual review created the same question: “Why do I still own this?”
By year seven, patience had nearly expired. The investor wanted to replace the international fund with the U.S. fund that had performed best. Yet the very performance gap causing the frustration had also widened the valuation gap. The winning market had become more expensive, while the neglected market offered higher dividend yields and more modest expectations.
The investor kept the allocation and rebalanced. That decision was not based on certainty that international stocks would win the following year. It was based on accepting that diversification often feels unnecessary immediately before it becomes useful.
The Retiree Who Planned for an Average Rather Than a Journey
A recent retiree assumed a portfolio would earn 7% annually and therefore withdrew money as though the return would arrive in smooth installments. The long-term assumption was not unreasonable, but the implementation ignored sequence-of-returns risk.
When stocks declined early in retirement, withdrawals required selling more shares at lower prices. The problem was not merely that returns were below average. It was that losses occurred while money was leaving the account.
The plan was revised to include a cash reserve, high-quality bonds, flexible spending rules, and a lower baseline return assumption. The portfolio did not suddenly become immune to markets. The retiree simply stopped requiring the market to cooperate on a strict monthly schedule.
The Saver Who Focused on Contributions
A younger investor saw forecasts suggesting that future equity returns might be lower than historical averages. The initial reaction was discouragement: if markets might return only 5% or 6%, why bother?
Then the investor calculated the effect of increasing monthly contributions. Raising the annual savings amount by a few thousand dollars had a larger and more dependable impact on the projected account balance than choosing between two uncertain return forecasts.
The experience changed the investor’s attention. Market predictions became planning inputs rather than emotional verdicts. Automatic contributions continued through rallies, corrections, recessions, and weeks when financial television discovered three new reasons the world was ending.
Seven years later, the portfolio’s exact annualized return mattered less than expected. The habit of contributing had done most of the heavy lifting.
Conclusion: Scratch the Plan, Not the Itch
Expected returns are essential for retirement projections, asset allocation, pension management, and investment decisions. They help investors connect today’s valuation with tomorrow’s potential. But they are estimates surrounded by uncertainty, not instructions to flee an asset class at the first sign of boredom.
The seven-year itch becomes dangerous when investors confuse patience with inactivity, recent performance with future potential, or a forecast with a guarantee. A sensible response to lower projected returns is to use conservative assumptions, diversify, rebalance, manage costs, maintain adequate liquidity, and test the plan against multiple outcomes.
The market will not deliver the same return every year. It may not deliver the forecast over exactly seven years. It may behave so strangely that the best explanation is eventually presented in a 400-page book with an ominous title.
What investors can do is build a plan that does not require perfect predictions. That may sound less exciting than finding the next unstoppable asset. It is also considerably more useful.
Note: This article is for general educational purposes and does not constitute personalized investment, tax, or legal advice. Expected returns are hypothetical, actual results can vary substantially, and all investments involve risk.

